As it was promised I will outline the steps to debug Windows IoT kernel running on Intel Galileo using JTAG interface . Why does somebody need this? JTAG interface gives more power over hardware and provides deeper insight into hardware state.
For debugging over JTAG using Windows host you will need
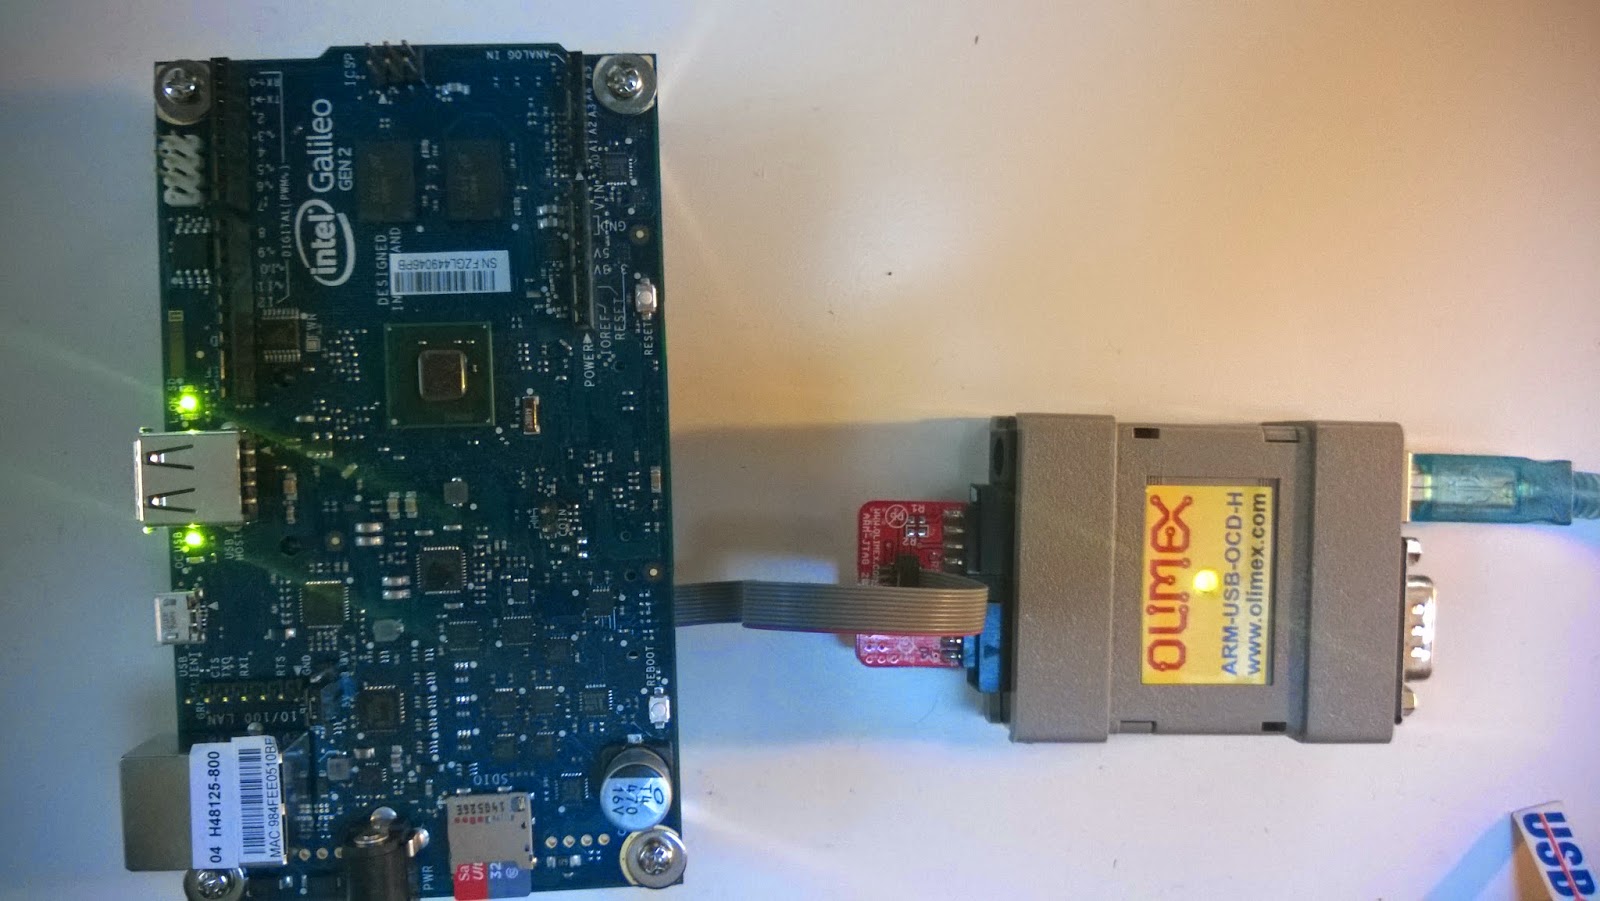
- a hardware JTAG debugger, I use OLIMEX ARM-USB-OCD-H
- an adapter from JTAG debugger to 10 pin connector, e.g. ARM-JTAG-20-10
- OpenOCD to communicate with JTAG debugger and provide a debug server connection for GDB
- MinGW for GDB
After everything have been assembled it looks like this
Then you need to start OpenOCD from cmd prompt by executing the following command
openocd-x64-0.9.0-dev.exe -f interface/ftdi/olimex-arm-usb-ocd-h.cfg -f target/quark_x10xx.cfg
For example this is an output om my PC

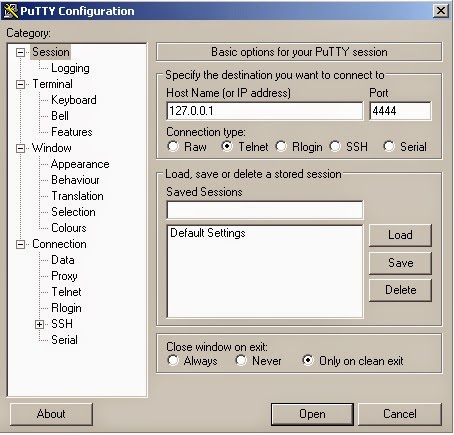
this provides you with a GDB server on the port 3333 and telnet connection with the OpenOCD on the port 4444. So you can connect GDB to the server by providing a command target remote localhost:3333 to GDB, for example

you can also connect to OpenOCD via your favorite telnet client, mine is PuTTY

For debugging over JTAG using Windows host you will need
- a hardware JTAG debugger, I use OLIMEX ARM-USB-OCD-H
- an adapter from JTAG debugger to 10 pin connector, e.g. ARM-JTAG-20-10
- OpenOCD to communicate with JTAG debugger and provide a debug server connection for GDB
- MinGW for GDB
After everything have been assembled it looks like this
Then you need to start OpenOCD from cmd prompt by executing the following command
openocd-x64-0.9.0-dev.exe -f interface/ftdi/olimex-arm-usb-ocd-h.cfg -f target/quark_x10xx.cfg
For example this is an output om my PC
this provides you with a GDB server on the port 3333 and telnet connection with the OpenOCD on the port 4444. So you can connect GDB to the server by providing a command target remote localhost:3333 to GDB, for example
you can also connect to OpenOCD via your favorite telnet client, mine is PuTTY
No comments:
Post a Comment